Global productivity growth decelerated about a decade ago and has yet to recover. Why?
Across the world, labour productivity – output per hour worked – has been growing at a historically low rate for about a decade. This slowdown has been particularly pronounced in advanced economies, as seen in the figures below.
Figure 1
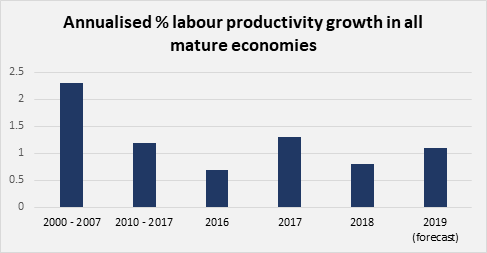
Source: Conference Board[1]
‘All Mature Economies’ includes the US, the EU and Euro-Area, Australia,
Canada, Israel, Hong Kong, South Korea, New Zealand, Norway, Singapore,
Switzerland and Taiwan
Looking at some of the world’s major advanced economies in the graphs below shows that the slowdown began at roughly the time of the global financial crisis (GFC) of 2008. Note that these graphs use linear scales and would therefore be expected to show an exponentially increasing trend under a stable rate of productivity growth; productivity growth since the GFC has been so poor that the post-2008 lines are below even the historic linear trend of productivity growth.
Japan Labour productivity (indexed for historical comparison; red line indicates GFC):
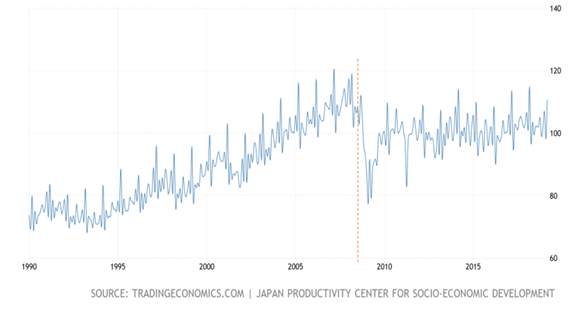
Figure 2
France Labour Productivity (indexed for historical comparison; red line indicates GFC)

Figure 3
Germany Labour Productivity (indexed for historical comparison; red line indicates GFC)

Figure 4
Canada Labour Productivity (indexed for historical comparison; red line indicates GFC)
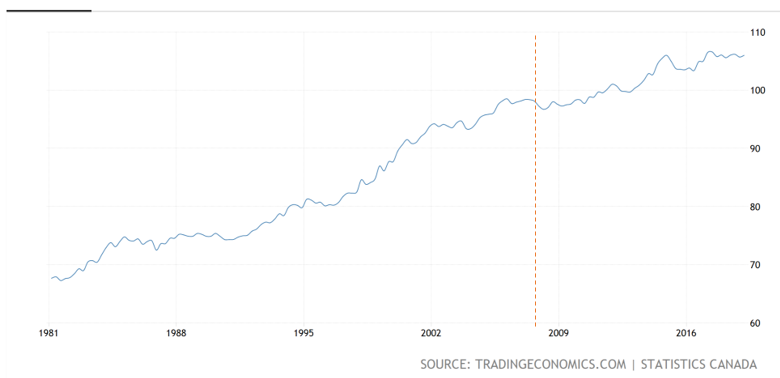
Figure 5
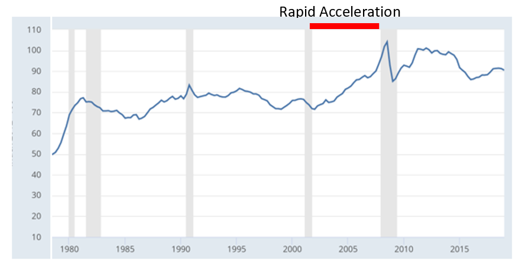
US Labour Productivity (indexed for historical comparison; red line indicates GFC)
Note the brief surge in productivity immediately the GFC – unlike other advanced economies, the recession in the US disproportionately affected relatively unproductive firms and, for surviving firms, caused unemployment for relatively unproductive employees. Hence the momentary surge in productivity.
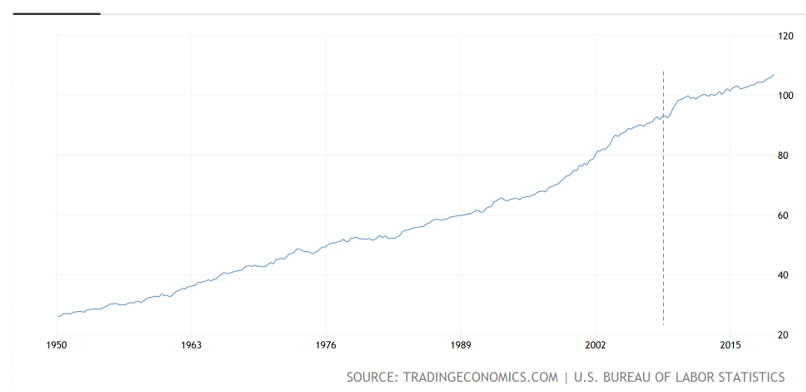
Figure 6
UK Labour Productivity (indexed for historical comparison; red line indicates GFC)
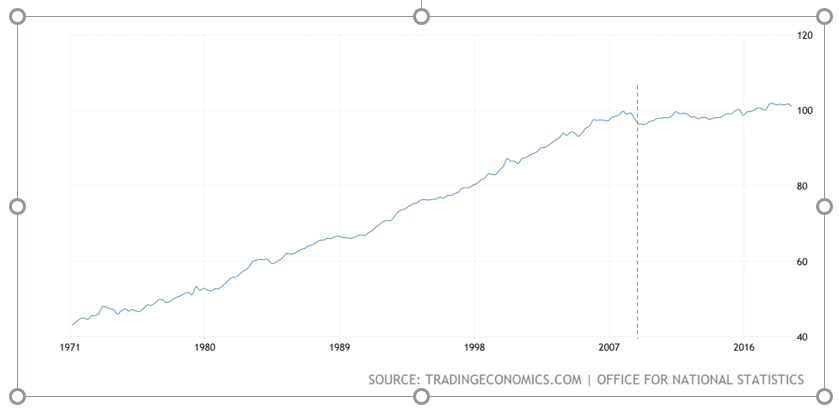
Figure 7
This is bad. In order to grow, the people in an economy need to work more hours or produce more per hour of work. Since there is a limit to the number of hours each person can work per year, long-term growth is dependent on growth in labour productivity. Rising global living standards will therefore be placed in jeopardy if the productivity slowdown persists.
Why has productivity growth slowed?
Many explanations have been proposed for the slowdown in productivity growth. Some refer to the proliferation of poor managerial practices[2], while others invoke the notion that the science underlying new technologies is becoming increasingly more difficult and resource-intensive to understand.[3] Trends in global trade, market concentration or regulatory environments have also been suggested as potentially linked to the productivity slowdown. And some have argued that it is merely a measurement artefact.[4]
However, these explanations often fail to take account of a number of important macroeconomic trends across major economies that have accompanied or preceded the slowdown. These trends reveal useful clues about its underlying causal mechanisms and therefore cannot be ignored.
In the following analysis, I will outline these clues and their implications for our understanding of productivity growth. I will present what I consider to be the most compelling explanation for the productivity slowdown in the light of this evidence, drawing in the process from existing accounts that relate to low interest rates, increasing market concentration and changes in global trade.
Clue 1: Increasing market concentration
There is a lot of evidence indicating that since about 1980, advanced economies have experienced rising market concentration. This means that a growing portion of sales and employment is being taken up by larger businesses that tend to dominate their industry.
For example, an Economist analysis found that “between 1997 and 2012 the weighted-average share of the revenues of the top four firms within each industry revenues rose from 26% to 32% of the total.”[5]
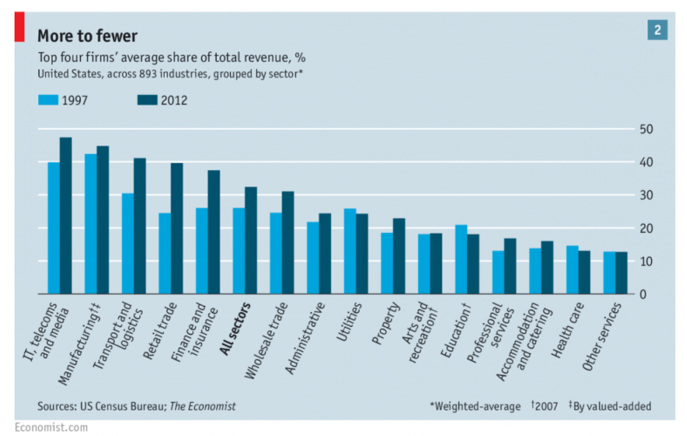
Figure 8
The Economist also found that profits had become increasingly concentrated at the upper end of the distribution, indicating a greater market share for the most successful companies.
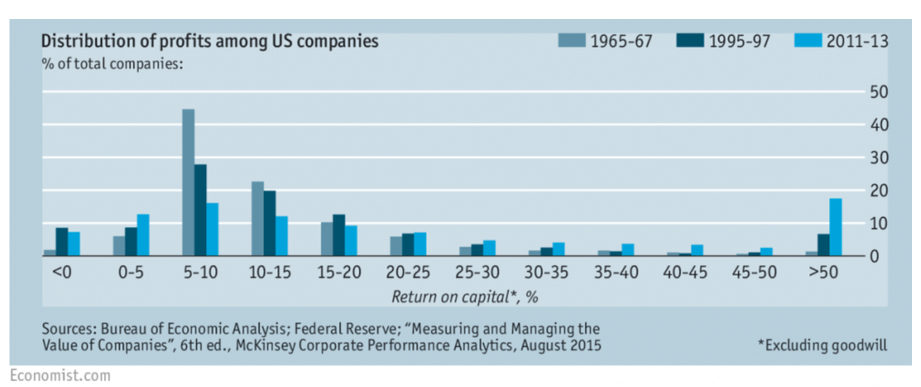
Figure 9
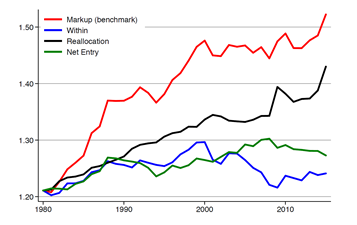
Further evidence for increasing market concentration comes from analysis of the mark-ups that companies are able to charge when selling their goods or services. The mark-up is the sales price of a good or service minus marginal cost[6] of producing it. The mark-up essentially reflects the portion of the sales price that the companies can use to cover their fixed costs (i.e. costs that do not vary with production volume) and then keep as profit once these costs have been covered. In highly competitive markets, we expect mark-ups to remain low because any firm charging a high mark-up can be easily undercut by a competitor with a lower mark-up. This would incentivise companies to lower their prices rather than charging high mark-ups while simultaneously ensuring that those who do not respond to this incentive achieve a lower market share.
However, when competition is weaker, the incentive to lower prices at the expense of mark-ups is reduced. This means that industries in which market concentration is growing (likely resulting in reduced competition) are expected to witness increasing mark-ups. Consistent with the hypothesis of increasing market share in advanced economies, evidence does indeed indicate that the weighted average of mark-ups charged by companies has increased considerably since around 1980. For example, the following data is from De Loecker et al.’s (2018) analysis of US mark-ups based on firm-level data from the US census as well as the Computstat database.
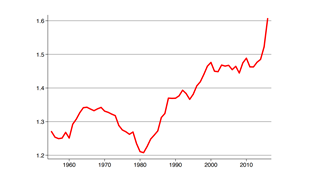
Figure 10: Average Mark ups of US firms over time
De Loecker et al. (2018) also calculate the extent to which the rise in mark ups has been due to various causes, such as the reallocation of market share to firms that already charge high mark ups, the tendency of individual firms to raise their mark ups over time or the effect of the market entry (vs. exit) of firms that charge a relatively high mark up. The results are shown below:
Figure 11: Mark up increase decomposed into different sources
The same authors used financial statements from 70,000 firms worldwide to conduct a similar analysis across countries:
Figure 12

Firms that dominate large segments of the market in the sectors in which they operate are not only able to charge higher mark-ups due to reduced competitive pressure. They are also in a stronger position to pay lower wages to their staff than would emerge under more competitive conditions. Firms are generally incentivised to offer higher wages and good working conditions in order to attract employees who might otherwise be drawn to work for their competitors; reduced competition limits this effect and thus suppresses wages.
This broad trend is evidenced by the decline in what is known as the ‘labour share’, which is the portion of national income that is taken up by compensation to workers (i.e. the labour share = total employee compensation across a country / nominal GDP). Various data sources show the labour share declining since the 1980s across developed countries. For example, Autor et al. (2015) use the KLEMS (capital, labour, energy, materials and service) dataset collated by the EU:
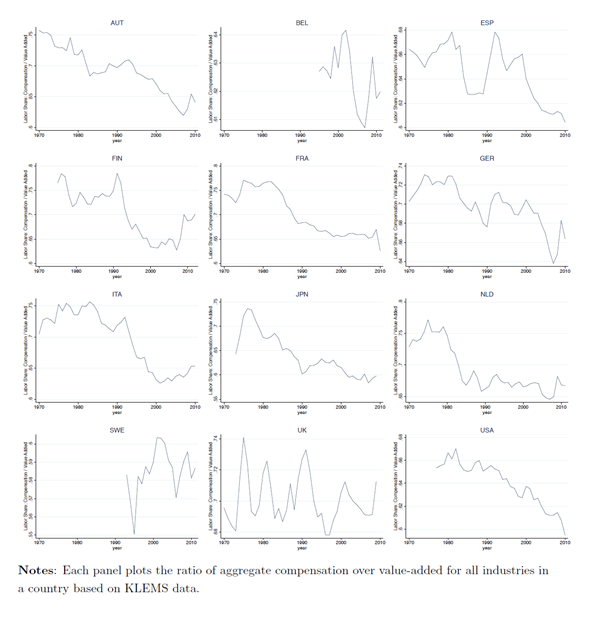
Figure 13: International Comparion – Labour Share by Country, from Autor et al., 2015
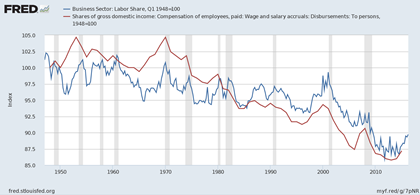
Data on the US labour share, including from more recent years, are provided by the Federal Reserve Bank of St Louis:
Figure 14: Labour share in the US
An interesting observation to which I will return later is that there seems to be a reversal or at least flatlining of this decline in the labour share from about the time of the GFC. There is not much year-to-year consistency across countries for most of the time period covered, but the slight uptick post ~2009 (around the start of the productivity slowdown) appears in almost all countries in the above data.
Clue 2: Declining Labour market fluidity
Labour market fluidity broadly refers to the efficiency with which labour is allocated to its most efficient uses. In a highly fluid market, we would expect frequent job switching to occur as workers are constantly reallocated to the firms that can make the best us of their skills; we would also expect to see workers frequently leaving and entering the labour force and transitioning from employment to unemployment as they respond to market signals that communicate (through wage fluctuations) whether the best use of their time is spent in work, looking for a new job or performing activities outside of the labour force (e.g. childcare). In a less fluid labour market, we expect to see less of these kinds of labour force transitions. This occurs when market distortions disrupt the price signals that encourage workers to transition to the most productive jobs, such as when productive firms pay too little and consequently attract fewer workers than would be optimal.
A rise in market concentration is expected to reduce labour market fluidity due to such wage distortions. This is because the few dominant, highly productive firms in a market would face relatively little competition for workers. In a totally competitive market, a firm that reduces its wages would expect to see its workers move to competing (better paying) firms. However, for firms that face less competitive pressure (i.e. those with large market shares), there is less incentive to refrain from supressing wages because workers would have fewer alternative employers to choose from. Although the market-dominating, wage suppressing firms still attract fewer workers than they otherwise would under such circumstances, this is outweighed by the savings achieved through reduced labour costs.[7] However, from workers’ point of view, the lower rewards associated with transitioning to a new firm and of work in general result in lower labour force participation, a reduced tendency to switch jobs or to temporarily exit the labour force in order to search for new employment, and longer time taken to find a new job in the event that unemployment does occur.
Consistent with this, Molloy et al. (2016) found that various measures of labour market fluidity have reduced in synchrony with the rise in market concentration discussed above. Their analysis addressed 8 different variables linked to labour market fluidity, two of which (job-to-job transfers, inter-state migration) are displayed below. Declining job-to-job transfers – which refer to movements by a worker form one firm to another – indicate reduced efforts by companies to attract labour from their competitors. Declining inter-state migration indicates reduced mobility of the workforce (people usually move between states for new jobs), which in turn implies reduced efforts by businesses to offer compelling employment offers capable of motivating people to migrate across states.
Figure 15: Job-to-Job transitions in the US
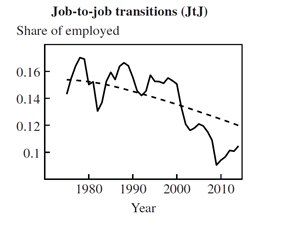
Figure 16: Interstate migration in the US

Clue 3: Productivity growth, mark-up growth and declining labour share are largely attributable reallocation of labour and reallocation of market share
A large part of the trends discussed in clue 1 is attributable to re-allocation effects in the domain of mark-ups and employee compensation. In other words, most firms have not increased their mark-ups very much since 1980, but mark-ups in the economy as a whole have increased substantially because the firms that charge the highest mark-ups account for an increasingly large portion of sales in the economy.
Likewise, the fall in the labour share in the US is primarily due to the fact that firms paying their workers a smaller portion of overall revenue have increased the percentage of all workers in their employment; most individual firms have not decreased the portion of their revenue paid to workers by very much over the past few decades.
Similarly, a firm-level analysis by Baqaee and Farhi (2017) shows that over the last 20 years (earlier data were not available), around half of the observed increase in US productivity is due to the fact that the market share of relatively more productive firms has grown. Baqaee and Farhi (2017) note that more productive firms also tend to be the ones that charge the highest mark-ups, so the reallocation to high mark-up firms and the consequent increase in economy-wide mark-ups is a direct parallel of the reallocation of productivity to more productive firms. Similarly, since firms with high mark ups and high productivity also tend to have lower labour shares, we can use the same line of reasoning to link the decline in the latter to the growth in the two former. In other words, increasing mark-ups, the declining labour share and productivity growth have, to a large extent, been driven by the same factor in recent decades: markets are becoming increasingly dominated by firms that are more productive, charge higher mark-ups and have a lower labour share.
Clue 4: Interesting Trends from about 2000 onwards
Clue 4 reflects a number of sub-clues that all pertain to additional interesting macroeconomic developments that occurred specifically from 2000 onwards. These are:
4a – A pause in mark-up increase, apparently driven by a pause in reallocation
Look back up at figures 10 and 11. You will see that the upward trend in mark-ups pauses across countries for the decade beginning 2000. Figure 11 shows that, at least in America (and presumably elsewhere given the ubiquitous nature of the trends discussed hither to), this was due to the fact that reallocation of market share to high mark-up firms paused.
4b – Declining job-to-job transitions, a reduced correlation between productivity and labour growth but, paradoxically, a continuing contribution of labour reallocation to productivity growth
Look back at figure 15 – one of the striking things about the decline in job-to-job transitions is that almost all of the 1980-to-2013 decline occurs between around 2000 and 2009. Moreover, there is evidence[8] that the firm-level correlation between employment growth and productivity reduced from 2000 onwards relative to before 2000. This means that not only did job-to-job transitions decrease, but they also involved fewer transitions from relatively low to relatively high productivity firms.
This is surprising, because productivity growth in the US from 2000-2007 had roughly the same annualised rate as 1990 – 2000, and evidence[9] indicates that around half of this productivity growth was due to workers being reallocated from relatively low to relatively high productivity firms. Moreover, research[10] has also found that most of the decline in America’s labour share from 1980 onwards is attributable to workers moving from high labour share firms (which tend to be relatively less productive) to low labour share firms (which tend to be relatively more productive). So we are presented with some puzzles: it is strange that productivity could continue to increase due to employment reallocation to more productive firms in a period during which reallocation of labour in general, and reallocation to more productive firms in particular, greatly decreased (as evidenced respectively by lower job-to-job transitions and a decline in the productivity-employment growth correlation at the firm level).
4c – Increasing Productivity Dispersion
There is evidence that since around the year 2000, the dispersion of productivity across firms has increased. This means that the difference in productivity between, for example, the firms in the top decile of the productivity distribution and the remaining population of firms has risen since around the year 2000. In other words, the variance in productivity across firms has increased.

Figure 18b – Increasing productivity dispersion across the OECD. ‘Frontier’ firms are those in the top 5% of the productivity distribution.
As a side note: when interpreting this trend, we need to bear in mind that it does not necessarily follow that firms at the upper portions of the productivity distribution are experiencing a greater rate of productivity growth than other firms. The identity of the firms situated at the upper portions of the productivity distribution can change over time, meaning that, for example, the top 10% most productive firms today may be very different from the corresponding decile five years ago. The fact that the productivity advantage of the top 10% of firms relative to all other firms is increasing does not necessarily imply anything about the growth rate about the population of firms occupying the top 10% of the distribution at any given point in time. For example, an analysis of French firms[11] found that the firms that were in the top 5% of the productivity distribution in 1998 subsequently regressed to the mean in terms of productivity, meaning that their productivity gradually became closer to what was typical of the overall population of firms. At the same time, however, the productivity advantage of the new populations of firms that went on to occupy the top 5% of the distribution at each yearly interval steadily increased, resulting in an increase in productivity dispersion over time.
4d – An increase in zombie companies
Zombie companies are companies that are only able to continue operating by making up for persistently negative profits with increasing borrowing. The number of zombie companies operating in an economy can give an indication of its effectiveness in weeding out firms that are using labour and capital inefficiently so that these resources can be used more efficiently by other companies.
Across advanced economies, the percentage of zombie companies has substantially increased since 2008 (figure 19). In the US, we see a large rise in the percentage of zombie firms between 1998 and 2003, followed by a subsequent period of stability. In Great Britain and the EU, we see a similar but less pronounced increase in zombie companies between 1998 and 2003, and then an additional increase following the GFC from 2008 onwards. The percentage of US companies classified as zombies can be seen to reach a far high level in 2003 relative to GB and the EU, with this difference persisting over time (see figure 20).

Figure 19 – Median percentage of firms classified as zombies across Australia, Belgium, Canada, China, Denmark, France, Great Britain, Germany, Spain, Italy, Japan, Netherlands, Sweden and the United States

Figure 20 – Zombie Companies in the US, Euro Area and Great Britain
5 – The solution
All of the above evidence can be accounted for by the following explanation:
Since 1980, market concentration grew. Regardless of the cause (which is a matter of debate), this has been bad for productivity because reduced competitive pressure results in less incentive to innovate. This explains the slight reduction in productivity growth seen post- relative to pre- 1980, though it cannot explain the more dramatic reduction observed from around 2008 onwards.
From 1980 until around 2000, we see the consequences of this growing market concentration: rising mark-ups and reallocation of revenue to high mark-up firms, a declining labour share and falling labour market dynamism. From around 2000, two important phenomena occur. First, global trade volumes rapidly accelerate, reflected in a rise in US exports and imports (see figures 21 and 22).
Source: St Louis Fed
Figure 21 – US Imports of goods and services (chain-type price index, 2012=100)
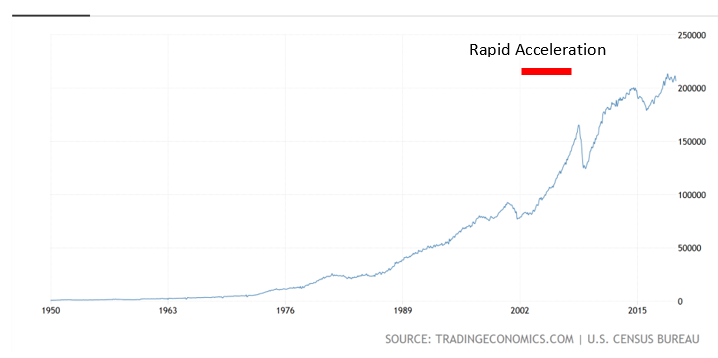
Figure 22 – US exports, billions of dollars
Secondly, interest rates drop to their lowest level in many decades. They begin to rise again in 2005 to reach 1990s levels by 2007 before dropping dramatically to a new record low after the 2008 financial crisis (figure 23).
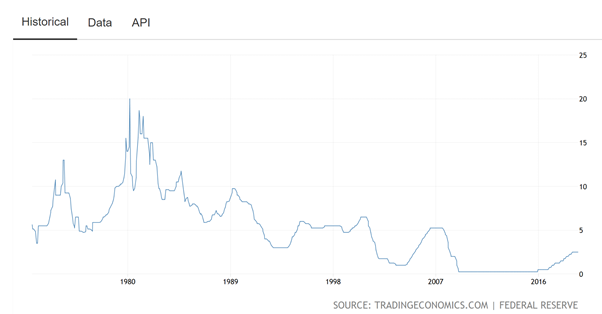
Figure 23 – US interest rates (%)
Low interest rates in the US resulted in less severe market discipline in the area of credit allocation. In a high interest rate environment, poorly performing firms are either forced to exit the market or, in cases of less extreme underperformance, accept reduced market share. However, in an environment in which credit is cheap and widely available, such as a low interest rate environment, weak firms can reduce losses to their market share and delay the onset of bankruptcy by borrowing cheaply to continue operating. With low interest rates, even firms making very small profits are likely to be able to cover their interest payments, and even those that don’t can forestall the onset of bankruptcy by continually refinancing outstanding debt – hence the historically low bankruptcy rates observed in the current economic recovery:
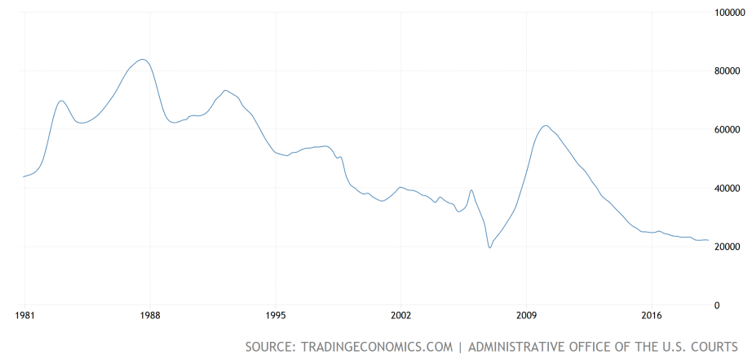
Figure 24: US bankruptcies
This means that relatively more credit gets allocated to relatively weaker businesses in the economy (for a more formal explanation of the impact of interest rates on the allocation of credit to firms of different creditworthiness, see Appendix A). The most obvious evidence for this is the rise of zombie firms, which by definition are reliant on credit to compensate for their operating losses. However, across the broader population of firms, evidence for misallocation of credit can be seen in the increasing risk profiles of issuers of corporate bonds from 2000 onwards.[12] And it is well known that the 2008 credit crunch and housing market collapse, particularly in the US but also to a very great extent in the rest of the developed world, was due to excessive and poorly directed lending.[13]
This over-supply of credit to poorly performing firms would hinder the normal process by which resources are reallocated to more productive firms. Rather than exiting the market and allowing their capital and labour to be purchased or employed by more productive competitors, poorly performing firms in a low interest rate environment can rely on debt to ensure continued operation, meaning that their labour and capital takes longer to be allocated to more efficient firms. This explains why the correlation between employment growth and productivity dropped from 2000 onwards – low-productivity firms hoarded labour, making it difficult for more productive firms to attract labour[14]. This also explains why job-to-job transitions decreased from the year 2000 onwards. Indeed, the decline in job-to-job transitions paused temporarily in the mid-2000s at around the same time as when interest rates briefly began rising again until 2008.
However, it is difficult to reconcile the post-2000 decline in the labour share with the notion that labour was being hoarded by relatively low productivity firms. If more productive firms were now finding it harder to source labour due to reduced shedding of employees by unproductive firms, they would have had an incentive to increase wages. Research cited previously[15] indicates that highly productive firms had hitherto been able to suppress wages (leading to a declining labour share) due to limited competition for labour; when this competition increased in 2000 as low productivity firms began to hoard labour, upward pressure on wages should have increased. Why, then, do we not see an increase in the labour share relative to the 1990s, where productive firms faced less competition for labour and thus had less incentive to increase wages?
The answer potentially lies in the increase in the US’ exposure to global trade from 2000 onwards. An important part of this trend was greater use of outsourcing for US companies, including those in highly productive sectors such as software. Outsourcing gave firms in developed countries a way to circumvent domestic labour shortages without increasing their wage bill – they could find foreign, much cheaper workers to do the jobs previously performed by domestic employees. Indeed, there is clear evidence that wages in sectors of the economy more exposed to the post-2000 increase in imports and exports, as well as those with industries more capable of outsourcing, grew less than those in less exposed sectors.[16] [17] [18]
Changes in trade can also explain why mark-ups and reallocation of revenue to low mark-up companies did not increase in the decade beginning 2000. The large increase in the availability of imports would have increased price-based competition among sellers of goods and services due to the accessibility of cheaper alternatives. This would have increased the incentive to reduce prices while making it harder for companies charging relatively high prices to increase their market share, hence the decline in reallocation of revenue to firms with high mark ups during this period. This explanation is consistent with evidence showing that increased involvement in international trade tends to result in reduced prices and better value-for-money for consumers.
Developments in interest rates and international trade are also likely to explain some of the trends we observe in productivity in the post-2000 decade. Credit allocation to poorly performing firms would have dragged down the productivity of, for example, the bottom 90% or bottom 50% productive firms, because this population would now contain more particularly poor performers (being kept alive by cheap credit) than previously. However, the same would not happen for firms at the upper ends of the productivity distribution, because the firms saved by cheap credit would be less likely to occupy this portion of the productivity distribution. Hence, low interest rates can explain the well-documented increase in the variability of productivity across firms.
But why, then, do we not see a decline in overall productivity growth? If the increase in productivity dispersion post-2000 was due to the fact that more very unproductive firms were bringing down the average of e.g. the lowest 50% or lowest 90% productive firms, this should also contribute to an overall decline in productivity over time relative to what would have been achieved without this phenomenon. But in reality, annualised productivity growth in the US between 2000 and 2008 was, if anything, slightly higher than for the 1990s.
Again, the answer comes from trends in trade. Exporting companies tend to be more productive than non-exporters, and export activity tends to be highly concentrated in a small portion of all exporting companies. This means that an increase in a country’s exports should lead to both a rise in overall productivity and a rise in productivity dispersion, as most of the gains would be captured by a small group of companies. So the gains from increased export penetration would compensate at the aggregate level for the productivity-inhibiting effects of low interest rates while exacerbating their impact on productivity dispersion.
The increased productivity dispersion from both rising exports and low interest rates also explains how reallocation of labour could account for most of the gains in productivity between 2000 and 2008[19], in spite of the fact that the correlation between productivity and firm growth declined post-2000 relative to pre-2000[20]. While particularly productive firms may have expanded employment to a lesser extent than previously, their productivity advantage over the remaining population of firms would have also been higher than before. This means that the productivity gain to the overall economy for each worker moving from a relatively low productivity firm to a relatively high productivity firm would be greater than previously. So even though the number of these worker movements would be reduced, their net impact on productivity would be maintained because the productivity gain from each individual worker movement would be higher.
What happened post-GFC?
On the view that productivity growth from 2000 – 2007 was dampened by low interest rates but with a compensating boost from export growth, the poor post-GFC productivity performance is easy to explain. The interest rate drops in the early 2000s paled in comparison to the enormous cuts to interest rates seen across the developed world in the midst of the financial crisis. And this time, there was no surge in global trade to mask the problem. On the contrary, there was a rapid deceleration in the growth of global trade:

Figure 25 – Global trade
This drop in interest rates caused a rise in zombie companies – we see a steady decline in bankruptcy numbers in the United States over the past decade (figure 24), indicating that many more companies were being kept alive by low interest rates. Due to the mechanisms described above, this led to a continued increase in productivity dispersion: more zombie companies bring down the productivity of the lower end of the productivity distribution more than the upper end. Indeed, evidence indicates that the productivity of the upper 5% of the productivity distribution of firms has continued to grow at the same pace for the pre- and post- GFC periods in the US[21], meaning that the overall productivity slowdown is likely due to the growing prevalence of zombies in the remaining 95% of the distribution.
Indeed, the effects of super-low post-GFC interest rates on labour hoarding by low productivity zombie firms can also be seen in the job transitions data presented above: the proportion of the workforce engaged in job-to-job transitions reduced further following the post-GFC interest rate cuts and appears never to have fully recovered (see figure 15). Likewise, separate evidence indicates that of those job-to-job transitions that were occurring, even fewer were from low to high productivity firms than previously.[22] This means that the contribution of labour reallocation to productivity growth would have slowed considerably, as was found by Baqaee and Farhi (2017).[23]
This explanation can also account for the other trends we see post-GFC. Why did the growth in mark-ups resume post GFC? Post 2000, we said that while market concentration (the primary cause of increased mark ups) continued rising, downward pressure on mark ups and the competitive advantage of high mark-up firms would be created by the surge in imports. Post-GFC, therefore, it follows that mark ups would be expected to resume their growth, because market concentration rose without any compensating effect of rising imports. Interestingly, though, most of the rise in mark-ups attributable to reallocation of market share to high mark-up firms occurred in 2016. Mark-up growth due to reallocation was very slow from 2000 – 2015, but surged in 2016, when interest rates started rising. Given that high mark-up-charging firms also tend to be more productive,[24] this suggests that reallocation of market share (likely to be correlated with reallocation of labour) to high-productivity firms began to accelerate when interest rates started rising again.
Similarly, we can ask ‘why did the labour share stop declining or even start growing slightly during the post-GFC recovery?’ Because cheap credit resulted in increased investment and employment by relatively poorly performing companies, leading to greater competition for labour. Indeed, given that high productivity companies tend to have the lowest labour shares, reduced allocation of labour to these companies would be expected to prevent further decline in the labour share. Note that the factor compensating for this phenomenon post 2000 – an increased ability of firms to rely on cheap foreign labour – was now less available (partly due to the decline in global trade, but also due to the rise in global wages and living standards). Consequently, firms would have had no choice but to compete to attract labour by offering higher wages. This explains the rise in the labour share and the slight recovery in measures of labour market flexibility observed after the GFC in figures 13, 14, 15 and 16.
To summarise, the reason for the post-GFC productivity slowdown appears to be related to the massive decline in interest rates. This led to hoarding of labour and resources by low productivity firms that would otherwise have been forced to exit the market, resulting in fewer transfers of employees to high productivity firms. This explanation can account for trends observed in productivity dispersion, wages, the labour share and the contribution of reallocation of labour to productivity growth.
Further Evidence
There are a number of additional pieces of evidence supporting the view that low interest rates reduced productivity growth by reducing the reallocation of resources (particularly labour) away from low productivity firms (henceforth ‘the reduced reallocation hypothesis’).
For example, consider the data on US fixed asset investment over the past 20 years. If capital is being inappropriately allocated to relatively poorly low productivity businesses, we would expect fixed asset investment to be directed towards resources that contribute relatively little to productivity growth (e.g. construction) to a greater extent than to resources that contribute relatively more to productivity growth (e.g. software). Indeed, we can see that post-GFC, software investment grew much slowly than, for example, construction investment, although there was an acceleration in software investment from around Q1 2016 onwards – when interest rates started to rise and productivity growth began to improve[25]:
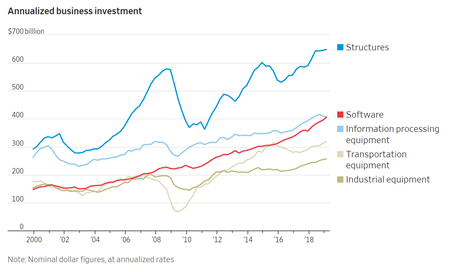
Figure 26 – Business investment by sector
Likewise, data from S & P 500 companies reveal a clear increase in business investment following the interest rate hikes that began in 2016 – prior to 2016, S&P 500 investment had been stagnating. Given that S&P 500 companies are far more productive than the average US firm, this indicates that the increase in interest rates resulted in a refocusing of investment activity back towards more productive firms.[26]
Similarly, an analysis of the share prices of publicly listed firms also supports the reduced reallocation hypothesis. Specifically, the recent interest rate increases that have been implemented since 2016 have coincided in a reduction in cross-company correlations in share prices. Before the recent interest rate increases, share prices of different companies moved in synchrony with each other to a greater extent than after the interest rate increases. Because the market as a whole was performing well, this undermined the performance of many short-selling hedge funds that specialised in identifying weak businesses – apparently, the internal weaknesses of these poorly managed firms were compensated for by the general market-lifting effects of low interest rates. In other words, short sellers were ‘burned’ because low interest rates were preventing resources from being allocated away from poorly performing companies, meaning that bets against these companies were less likely to pay off.
However, after the recent interest rate hikes beginning in 2016, correlations between the share prices of different firms increased. In other words, the market began to be more discriminating between poorly performing and well performing firms, resulting in bigger wins for hedge funds specialised in identifying poor performers and increased allocation of resources away from these companies.[27] This link between interest rates and inter-company share price correlations supports the view that low interest rates result in reduced allocation of resources away from poorly performing firms.
Summary
Having presented an explanation for the post-GFC productivity slowdown in the US, we can now go through clues 1 – 5 to summarise how they have informed our understanding of productivity growth.
Clue 1 related to various trends that indicate growing market concentration in both the US economy and across the OECD. Growing market concentration can explain the long-term changes observed over the past ~50 years in the labour share, mark ups and profit distributions. Clue 3 showed that these changes were due to the reallocation of market share to high mark up, low labour share, high profit firms and were not due to aggregate increases in these variables across all firms.
Whilst this trend in market concentration can explain the slight productivity slowdown observed post-1970 relative to pre-1970 (as per Grossman et al. 2017), it cannot explain the sudden, more pronounced and far more global productivity slowdown that occurred around the time of the GFC.
This is problematic for accounts of that relate the post-GFC productivity slowdown to a rise in market concentration. For example, Liu et al. (2019)[28] argue that low interest rates favour large, market-dominating businesses and thereby created a highly concentrated market structure that was uncompetitive and thus resulted in low investment and, consequently, low productivity growth; Autor et al. (2017)[29] argue that post-GFC, the ‘superstar firms’ that began to dominate markets were able to prevent the knowledge and expertise underlying their dominance from being disseminated across the market, thereby slowing overall productivity growth as fewer firms were able to benefit from technological advances.
These accounts are difficult to reconcile with the evidence because market concentration did not suddenly become a problem at the time of the productivity slowdown; it has been an increasing problem for the past 40 – 50 years and it is therefore unreasonable to expect its impact on productivity growth to be so heavily focused around the time of the GFC.
Clue 2 related to trends in labour market fluidity, particularly the fact that job-to-job transfers decreased suddenly around the year 2000 (roughly when interest rates started falling to a hitherto record low), stopped decreasing in the mid-2000s (as interest rates rose again) and then dropped suddenly again around the time of the mega-cuts in interest rates that occurred around 2008 due to the GFC.
We said that the post-2000 reduction in job-to-job transfers was likely caused by the simultaneous drop in interest rates and the consequent hoarding of labour by less productive companies. In low interest rate environments, the market forces that divert resources (including labour) away from low productivity firms become weaker, meaning that it takes longer for them to exit the market while ensuring that they capture a greater share of labour and investment (hence the rising number of zombie companies). This meant that post-2000, fewer workers exited low productivity firms in search of new work, and the correlation between employment growth and productivity at the firm level dropped (clue 4b).
However, rising productivity dispersion occurred over the same period, partly due to low interest rates and partly to rising exports. This meant that the smaller number of workers still transitioning to high productivity firms had a larger impact on overall productivity, because the firms to which they were transitioning had a greater average productivity advantage than would have previously been the case. This in turn meant that overall productivity growth remained normal by historical standards until around 2008 and that reallocation of workers to high productivity firms continued to contribute strongly to productivity growth (as per Baqaee and Farhi (2017); clue 3).
But after 2008, the low interest problem got worse and the compensating effect of growing exports was no longer present. This can be seen in the fall in US bankruptcy numbers post-GFC, reflecting lower exit rates of low productivity firms. Consequently, job-to-job transitions were even lower than in the 2000 – 2007 period as low productivity companies hoarded labour even more. Moreover, of the job-to-job transitions still occurring, even fewer were to high productivity companies than in 2000 – 2007[30], again because of interest rates were even lower than in the 2000s. Overall productivity growth therefore slowed dramatically as the shift of labour towards more productive firms declined. Indeed, Baqaee and Farhi’s (2017) analysis indicates that the post-GFC productivity slowdown in the US was almost entirely due to a decline in the allocation of labour to more productive firms.
This, then, explains why the US experienced a post-GFC productivity slowdown. Of course, it would be expected that a reduced tendency for the market to allocate resources to high vs. low productivity firms would also have an indirect negative impact on productivity by lowering the technological advances required to boost national productivity in the long term. If the rewards for businesses that achieve high productivity are lower, then there will be less incentive to pursue productivity-enhancing innovations. It is therefore likely that some of the US’ productivity slowdown reflects not merely a reduced tendency for the market to allocate more resources to more productive firms, but also lower overall investment in innovation. This possibility is supported by the fact that the recent hikes in interest rates appear to have prompted more investment in technology-enhancing areas such as software.[31]
The labour-hoarding of relatively low productivity firms would increase overall demand for labour, thereby reducing unemployment and increasing wages. This explains the historic lows in unemployment and the apparent cessation of the decline in the labour share observed in the current, post GFC-expansion across the OECD. In the 2000 – 2008 period, we said that the labour share declined in spite of labour hoarding by low productivity firms, because the increased opportunities for offshoring afforded by the rapid acceleration in global trade compensated for what would otherwise have resulted in an increased demand for domestic labour. Indeed, global trade and America’s exposure thereto plateaued after the GFC following a rapid acceleration beginning in 2000. This also accounts for the pause in increasing mark ups after the year 2000 and its resumption following the GFC – inputs put downward pressure on prices, thereby preventing increased allocation of market share to high mark-up firms.
Hence, the low-interest-rate explanation for poor productivity growth is consistent with other trends observed in the labour share, global trade,
Generalising from the US to other advanced economies
Most of the data presented above pertain specifically to the US. However, many of the trends identified hold true across the OECD and, in some cases, beyond. These include the trends relating to rising market concentration since ~1980, increasing productivity dispersion since ~2000, the emergence of super-low unemployment in the recovery from the GFC, the post-1980 decline in the labour share and the recent pause in this decline, the rise in zombie companies, and the modern era of super-low interest rates. Furthermore, the recent productivity growth recovery in the US has not been observed in other advanced economies that refrained from raising interest rates when the US did so.
Moreover, there is no reason why the basic mechanism linking low interest rates to the productivity decline in the US (increased survival of low productivity firms -> failure to reallocate labour and other resources to high productivity firms) would not be applicable in other countries. It therefore stands to reason that low interest rates are likely to have caused the productivity slowdown across the world, not just in the US.
Appendix A
The basic explanation for the link between growing numbers of zombie companies and low interest is that zombie companies can survive for longer by relying on cheap credit. However, the problem with this explanation is that low interest rates should also benefit strong companies by enabling to finance investments more cheaply. In order for low interest rates to increase the prevalence of zombie companies, there needs to be a mechanism by which low interest rates advantage poorly performing companies to a greater extent than other companies.
This mechanism can be illustrated with an example. Consider two banks deciding how to lend the money under their control. Bank A is run by an incompetent manager who is incapable of discriminating between companies that are likely to be profitable vs. those at risk of failure. Bank B is run by a competent manager who is able to distinguish between companies in this way.[32] Let us think about what lending strategies the two banks would under different interest rates.
Let’s say that there are five types of company of varying strength seeking to borrow money, with strength being defined by the annual return on capital that they will each generate in the future through the investment made with the borrowed funds: companies 1, 2, 3, 4 and 5 are destined to earn a return on capital of 1%, 2%, 3%, 4% and 5%, respectively.
Now let’s also say that interest rates are at 3% – there is no incentive for bank A or bank B to lend money at less than 3%, because this 3% could be achieved by buying a super-safe asset (e.g. a government bond) or keeping money saved in an account with the central bank). What will happen? Bank A, being unable to discriminate between strong and weak companies, will offer all of them the same rate of interest.[33] This will have to be above the 3% central bank interest rate to account for the fact that some loans will eventually go bad.
Bank B, being able to discriminate between companies of different strengths, will be forced to offer a similar interest rate to bank A in order to compete in the lending market – no company will borrow from bank B if its interest rate is far higher than that of bank A. But bank B knows that only companies 4 and 5 will have a good chance of being able to pay off a loan at greater than 3% interest, so bank B will only approve loans to these companies at a rate that is competitive relative to that offered by A. Consequently, companies 1, 2 and 3 are likely to borrow from bank A, while companies 4 and 5 will borrow from B. Let’s say that this process is generalised on a large scale, so that bank A ends up with a loan book comprising mainly poorly performing companies while bank B’s loan book contains mainly strong companies.
Then, of course, the market will punish bank A for failing to discriminate between creditworthy and non-creditworthy companies. Due to defaults, the value of A’s loan book will transpire to be less than the net present value of the originally lent funds, whereas B will make a profit. Consequently, the market allocates financial resources to financial institutions capable of allocating credit effectively.
But what happens when, for example, the interest rate drops to 0.25%? In such a scenario, A would again offer all companies a similar rate of interest just above the central bank rate, because A is incapable of discriminating between strong and weak businesses. B offers a similarly low interest rate in order to compete with A. But now, B has no reason to turn down any companies in our example, because all companies are likely to be capable of repaying a loan with an interest rate slightly above 0.25%.
In other words, B’s competitive advantage over A is greatly reduced in a low interest rate environment. Whereas in a high interest rate environment we would expect to see banks like B gradually dominating the market, in a low interest rate environment it would take much longer for A to lose market share to B. And since conducting the research necessary to discriminate strong and weak companies is costly in itself, it may even become economically viable for banks to position themselves strategically to be more like A than like B.
Consequently, in a low interest rate environment, we expect to see banks become less skilled at identifying and restricting access to credit for weak businesses. It therefore becomes easier for weak companies to acquire credit – not just because credit in general is cheap, but because financial institutions will have less incentive to identify their weakness and refrain from lending to them on account of it. Even in our above scenario, a company destined to make a massive loss on its investment – which both A and B would definitely want to avoid – would have a better chance of accessing credit if more banks are behaving like A than like B due to the altered competitive pressures created by low interest rates.
In this way, low interest rates can create a financial environment in which lenders generally fail to discriminate between strong and weak companies, which clearly would advantage weak companies while disadvantaging strong companies (by preventing them from taking advantage of their strength to access credit on favourable terms relative to the market average).
Indeed, evidence indicates that the recent rise in zombie
companies is strongly related to the declining state of banks’ balance sheets
and their ability to keep bad debt off their loan books. This is exactly what
we would expect to see if the proliferation of zombie companies has arisen as a
result of more banks behaving like bank A in our example as opposed to bank B.
[1] https://www.conference-board.org/data/economydatabase/index.cfm?id=25667
[2] https://www.telegraph.co.uk/business/2017/03/20/bad-managers-blame-uks-productivity-crisis-says-bank-englands/
[3] https://www.nber.org/papers/w19895
[4] https://www.oxfordmartin.ox.ac.uk/downloads/academic/201809_ProductivityParadox.pdf
[5] https://www.economist.com/graphic-detail/2016/03/24/corporate-concentration
[6] The marginal cost means the cost of producing one more of something. For example, if the cost incurred by a factory that prints 21 books is £1 greater than the cost of producing 20 books, the marginal cost of producing the 21st book would be £1. This does not reflect all production costs, because some expenses will be incurred in running the factory independently of the number of books are produced (e.g. rent, insurance etc). These latter costs are called ‘fixed costs’ because they do not vary as a function of the amount of output produced.
[7] For a mathematical formalisation of the impact of reduced employer competition on wages and labour market fluidity, see XXX
[8] https://www.brookings.edu/research/declining-business-dynamism-implications-for-productivity/
[9] https://voxeu.org/article/aggregate-productivity-and-rise-mark-ups
[10] https://economicdynamics.org/meetpapers/2018/paper_1171.pdf
[11] https://publications.banque-france.fr/sites/default/files/medias/documents/wp662.pdf
[12] https://www.bloomberg.com/opinion/articles/2017-09-19/the-financial-system-s-weak-link-zombie-firms
[13][13] https://www.bis.org/publ/work345.pdf
[14] https://www.brookings.edu/research/declining-business-dynamism-implications-for-productivity/
[15] https://hbr.org/2017/05/research-the-rise-of-superstar-firms-has-been-better-for-investors-than-for-employees?referral=03759&cm_vc=rr_item_page.bottom
[16] https://link.springer.com/article/10.1007/s10663-016-9352-4
[17]http://www.krannert.purdue.edu/faculty/hummelsd/research/HJMX%20Danish%20outsourcing%20version%209.pdf
[18] https://economics.mit.edu/files/10590
[19] https://voxeu.org/article/aggregate-productivity-and-rise-mark-ups
[20] https://www.brookings.edu/research/declining-business-dynamism-implications-for-productivity/
[21] https://hbr.org/2015/08/productivity-is-soaring-at-top-firms-and-sluggish-everywhere-else
[22] http://econweb.umd.edu/~haltiwan/w23693.pdf
[23] https://voxeu.org/article/aggregate-productivity-and-rise-mark-ups
[24] http://www.janeeckhout.com/wp-content/uploads/RMP.pdf
[25] https://www.wsj.com/articles/if-the-economy-booms-thank-software-11559140991
[26] https://www.wsj.com/articles/big-companies-tightened-spending-as-trade-fears-intensified-11558258201
[27] https://www.ft.com/content/16bd057a-668d-11e9-9adc-98bf1d35a056
[28] https://scholar.princeton.edu/sites/default/files/ernestliu/files/lms20190111.pdf
[29] http://cep.lse.ac.uk/pubs/download/dp1482.pdf
[30] https://www2.census.gov/ces/wp/2017/CES-WP-17-63.pdf
[31] https://www.wsj.com/articles/if-the-economy-booms-thank-software-11559140991
[32] To illustrate the point, we will assume that A is totally incompetent (i.e. there is no correlation between a company’s creditworthiness and its perceived creditworthiness as assessed by A) and that B is totally competent (i.e. there is a perfect correlation between a company’s creditworthiness and its perceived creditworthiness as assessed by B). In practice, we would not encounter such extremes in financial markets,
[33]
In practice, A’s incompetence would probably offer different rates of interest
to different companies on the basis of what A perceives to be their
strength level. But since A is incompetent, this perception has little relation
to the companies’ actual strength. Consequently, some weak companies would end
up on A’s balance sheet while paying a lower interest rate than what their
riskiness should command, even if by luck A happens to charge a high rate for
some weak companies. Likewise, strong companies that A incompetently charges a
high interest rate will simply seek loans from B.
